
 Ombra
Trailing max loss, explained in one chart
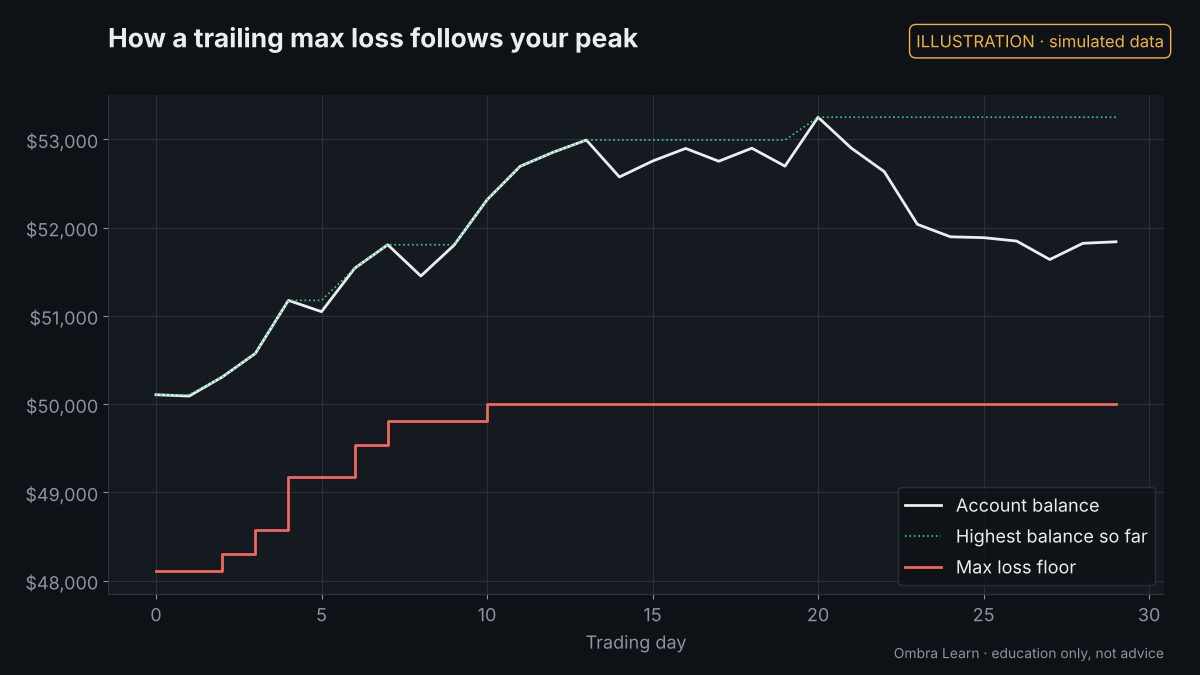
Most evaluations have a maximum loss: if your balance falls to a floor, the account fails. With a trailing max loss, that floor moves up as your highest balance moves up.
In the illustration, a 50K account starts with a floor $2,000 below the starting balance, at $48,000. Each new high pulls the floor up by the same amount. A pullback does not pull it back down.
In this example the floor stops trailing once it reaches the starting balance. Firms differ: some trail on closed balance, some on open profit, and some stop trailing at a set level. Read your own firm's rules for the exact method.
The practical point: after a good run, your room to lose is still $2,000 from the peak, not from where you started. Profits on paper do not widen the cushion.
Write your current floor down at the start of each session, so the number is in front of you before you place a trade.
Education only. Not advice. Trading futures carries risk of loss; evaluations use simulated accounts.